Designing the Monitoring Pipeline
That Actually Works
We build end-to-end observability pipelines tailored to your stack—from ingestion to alerting. Stop chasing alerts and start understanding your system.
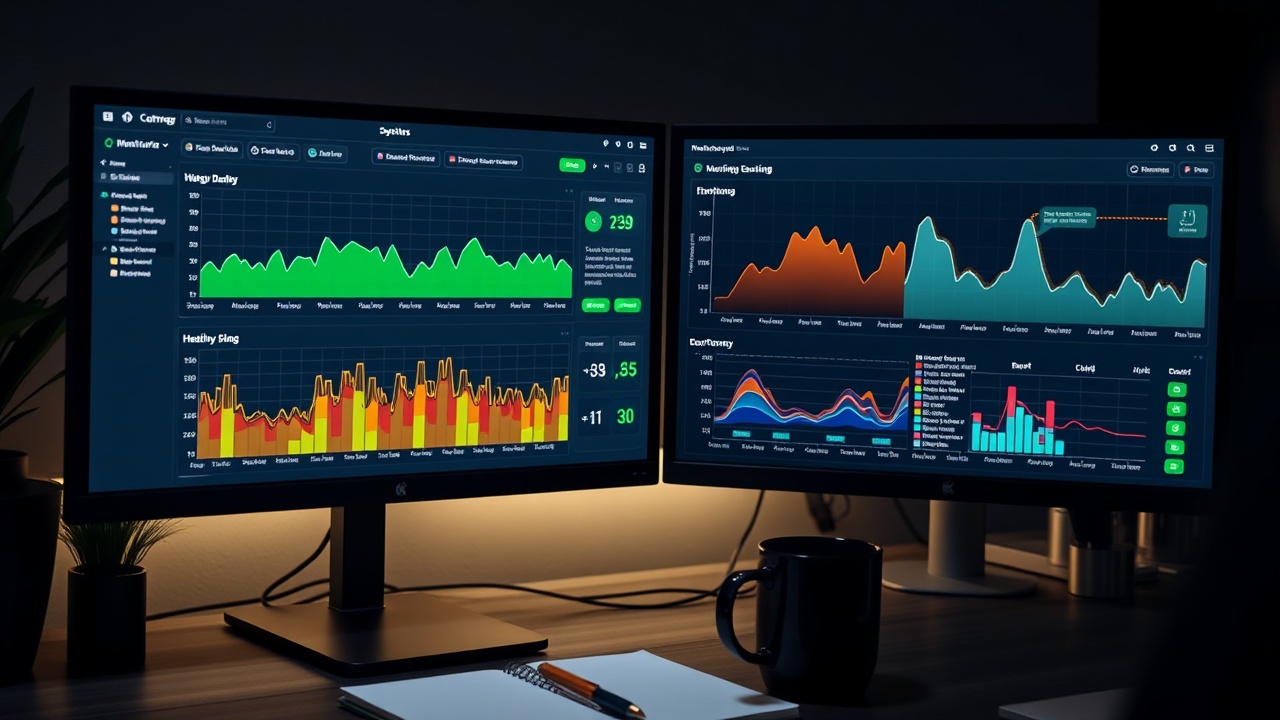
from ingestion to alerting
When your monitoring is busier
than your engineering team
You have dashboards. You have alerts. But you’re still spending your nights on fire drills. Why? Because your pipeline is noisy, unstructured, and disconnected from the business context.
Most monitoring stacks are built by vendors, not by people who understand your specific architecture. The result is a flood of generic errors that drown out the real issues. We fix this by designing pipelines that filter noise, enrich data with context, and route the right signals to the right people at the right time.
It’s not about adding more tools. It’s about building a system that thinks like your team. We map every log event to a business outcome, ensuring that when an alert fires, it’s worth waking up for.
Whether you are ingesting 50 GB/day or 5 TB/day, we design pipelines that scale with you, cost-effectively, and without the operational bloat.
The four pillars of a reliable pipeline
We don't just set up tools. We engineer the flow of data from source to action.
Ingestion Layers
Robust, high-throughput ingestion using Vector, Fluent Bit, or Logstash. We handle buffering, retry logic, and schema enforcement at the edge to ensure no data is lost.
Enrichment Rules
Transform raw logs into actionable insights by enriching them with metadata. We integrate with your CI/CD pipelines, service registries, and cloud providers to add context automatically.
Alert Routing
Smart routing logic that prioritizes severity and context. We configure multi-channel notifications (Slack, PagerDuty, Email) so the right person gets the right alert, instantly.
Escalation Trees
Automated escalation policies that prevent alert fatigue. If an issue isn't acknowledged within the SLA window, the alert intelligently moves up the chain of command.
Tool agnostic. Result driven.
We work with the tools you love, and we recommend the ones that fit your scale.
From chaos to clarity, step by step
01. Discovery
We audit your current logging architecture, identify bottlenecks, and map your data flow to understand exactly what you're dealing with.
02. Blueprint
We design a custom architecture diagram and define the specific enrichment rules, alert thresholds, and routing logic for your environment.
03. Build
Our engineers write the Terraform, Helm charts, and pipeline configurations. We deploy to staging, test under load, and validate the data flow.
04. Handoff
We document everything, run a training workshop with your team, and hand over the keys. You get a fully operational, self-documenting pipeline.
Case Study: FinTech Scale-up
A Series B fintech company was drowning in 2,000+ daily alerts. We redesigned their pipeline using OpenTelemetry and Grafana, implementing smart enrichment rules that reduced noise by 80%.
Result: Mean Time to Resolution dropped from 45 minutes to 12 minutes.
Stop guessing. Start monitoring.
Book a discovery call to discuss your current stack and see how we can design a monitoring solution that scales with your business.